Gold Research-SupportTM
At Gold Research, we understand that you often need only ad-hoc support with the flood of research assignments. It could be because you are swamped or a key team member is on leave. We get it! That is why we offer “Gold Research-SupportTM.”
- You will have access to our expert survey programmers, data processers, and savvy researchers for your ad-hoc projects.
- We can lend a hand to support your existing team or take on the complete project from soup to nuts.
- Whether it is survey programming, tabs, report development, or charting for reports, Gold Research-SupportTM” will fill-in so that you are always on-time, on-budget and on-strategy.
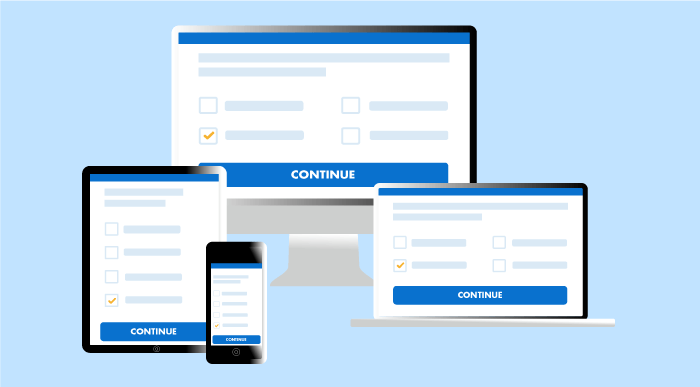
Do you need help with programming and hosting online surveys? Do you wish to create and deploy mobile surveys that are 100% compatible with all smartphone and tablet models? Are you seeking help with processing survey data and coding open ends?
Look no further than Gold Research-SupportTM. We program and host online and mobile surveys that are fun and engaging for your target audience. We process your survey data (including open-ends) and deliver it to you in a user friendly Excel or Word format.
Our programmers are specialists in converting questionnaires into fun-to-answer online and mobile surveys that are optimized for all devices thereby significantly boosting response rates. Surveys programmed by Gold Research-SupportTM boast a 75% completion rate. That’s 3 times higher than our competitors!
We use this process for all your survey programming needs:
- Step 1: Questionnaire Submission – Send us your survey questions in MS Word format.
- Step 2: Review – Our senior research team will review your questionnaire, test skips and logic, and suggest improvements. Clients tell us that this stringent review process by our senior researchers is a critical ingredient in averting survey disasters and in ensuring that data gets collected correctly.
- Step 3: Programming – Our programming team will convert your questionnaire into its online and/or mobile version. After the survey has been optimized and tested, it is once again sent to the senior research team for review and approval prior to being sent to you.
- Step 4: Sign-Off – Once you review the survey for the final time and sign-off, it is ready to launch. We can manage data collection, process tabs, and even deliver a results report in PowerPoint ready for presentation for your internal client.
Click here to view a case study on our survey programming services.
We use industry leading tools like WinCross, SPSS Q, and Quantum to process survey data.
Once data has been processed, we submit the tabs and open ends in an Excel or Word format.
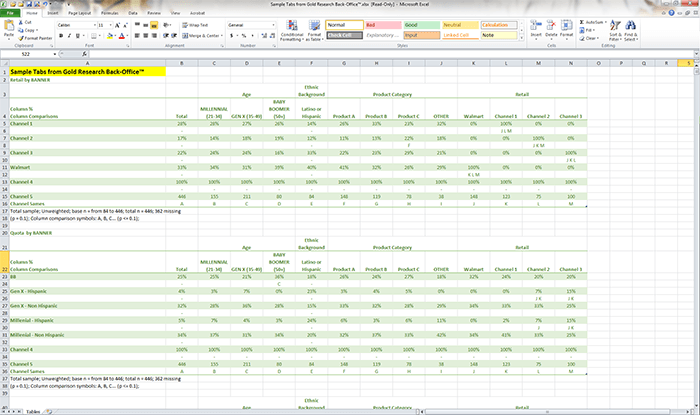
Statistical significance testing is standard for all tab outputs and deliverables.
Here is an example of our tabs output:
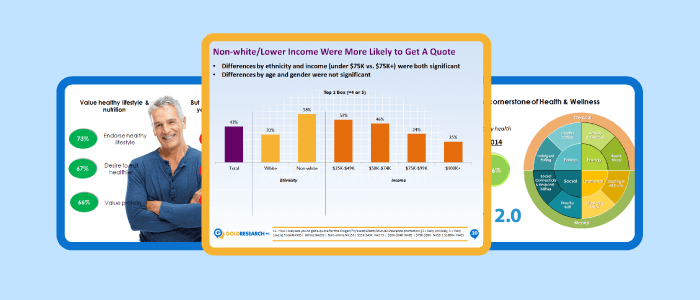
Do your research decks and insights reports look boring? Are clients falling asleep reading them? Would you like to present information in a way that’s more exciting, fun and engaging?
Our team of researchers and graphic designers can help!
Like you, we are always striving to better our reports by making them more fun and engaging to read. We have found great success by deploying graphic design and infographics to communicate findings.
The examples below show a “Before & After” view of our reporting style, which is focused on making typical information slides more interesting and compelling.
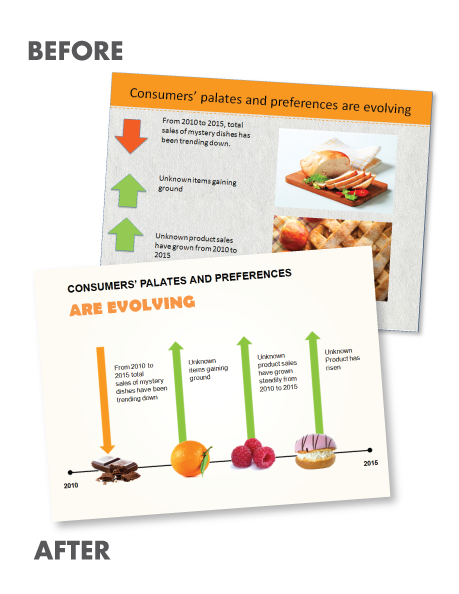
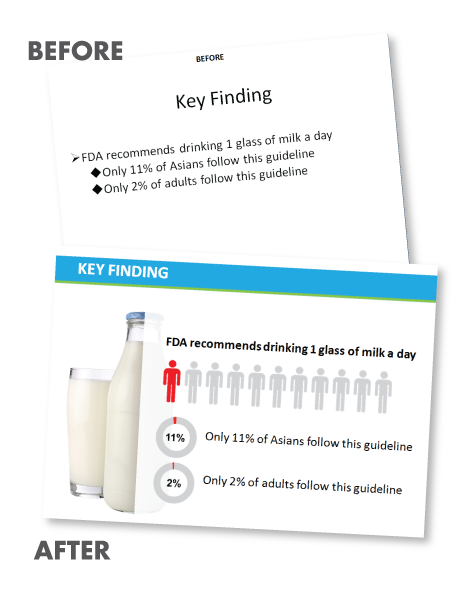
Let us put the “WOW” back in your research reports.
How it works:
Step 1:
Email us the data you wish for us to help analyze and present.
Step 2:
Our research team will process your data and develop the analysis plan, which we will submit for your approval. If you wish to do your own analysis, then we will just create the charts or graphs for each slide using your analysis plan. Our graphic designers will develop the design and a few initial slides for your review and ultimate approval.
Step 3:
Once approved, we’ll begin development of the whole deck.
Step 4:
The senior research team and graphic designers will work together to create slides that will be fun and engaging. Forget boring data tables that never get noticed. Every slide will be brochure quality and make people take notice.
Step 5:
Once the deck has been completed, we’ll email it to you in PowerPoint format for review. Let us know if you want any slides to be edited. We are always happy to re-construct a slide if needed. That’s how serious we are about achieving your total satisfaction!
Click here to view a case study on our report development services.
Awarded by Feedspot
![]()
Contact Us
1-800-549-7170
GoldResearch, Inc.
8000 I.H. 10 West | Suite 600San Antonio, Texas, 78230
Testimonial
“Gold Research’s analytical and graphic design teams were top notch. They were quick to understand the goals, attentive to detail, and communicated well. They got every detail right the first time. This engagement saved many hours of work for us and transformed the PowerPoint deck to something much more visually appealing. Excellent results and easy to work with.”

Case Study: “Making Presentations More Visual & Engaging”
The Challenge
Ardent Mills wished to develop research presentations that would be insightful and visually engaging for its marketing and sales teams. Gold Research, Inc. was engaged by Ardent Mills to act as an extension of their research team. Gold Research had to review complex reports, convert to presentation deck format, then use graphic design skills to convert to visually appealing presentations. These presentations would then be used by multi-channel marketing and sales teams.
Case Study: “On Demand Research Support”
The Challenge
The Vice President of Marketing of a consumer goods company was looking for a partner that could support their growing research needs.
Case Study: “Find a bilingual researcher for annual recurring research projects.”
The Challenge
The nation’s leading printer manufacturer, needed assistance with finding a strong, bilingual researcher who had to be based locally and could assist with annual recurring market research projects.